Watch These 2 Criticial XRP Levels This Week: Ripple Price Analysis
Ripple’s decline has temporarily halted at the 200-day moving average, triggering a slight rebound. However, weak market participation and low momentum suggest a high probability of continued consolidation and short-term retracements. XRP Price Analysis By Shayan The Daily Chart Ripple’s recent impulsive decline has been paused at a significant confluence of support levels, including the […]

Ripple’s decline has temporarily halted at the 200-day moving average, triggering a slight rebound. However, weak market participation and low momentum suggest a high probability of continued consolidation and short-term retracements.
XRP Price Analysis
By Shayan
The Daily Chart
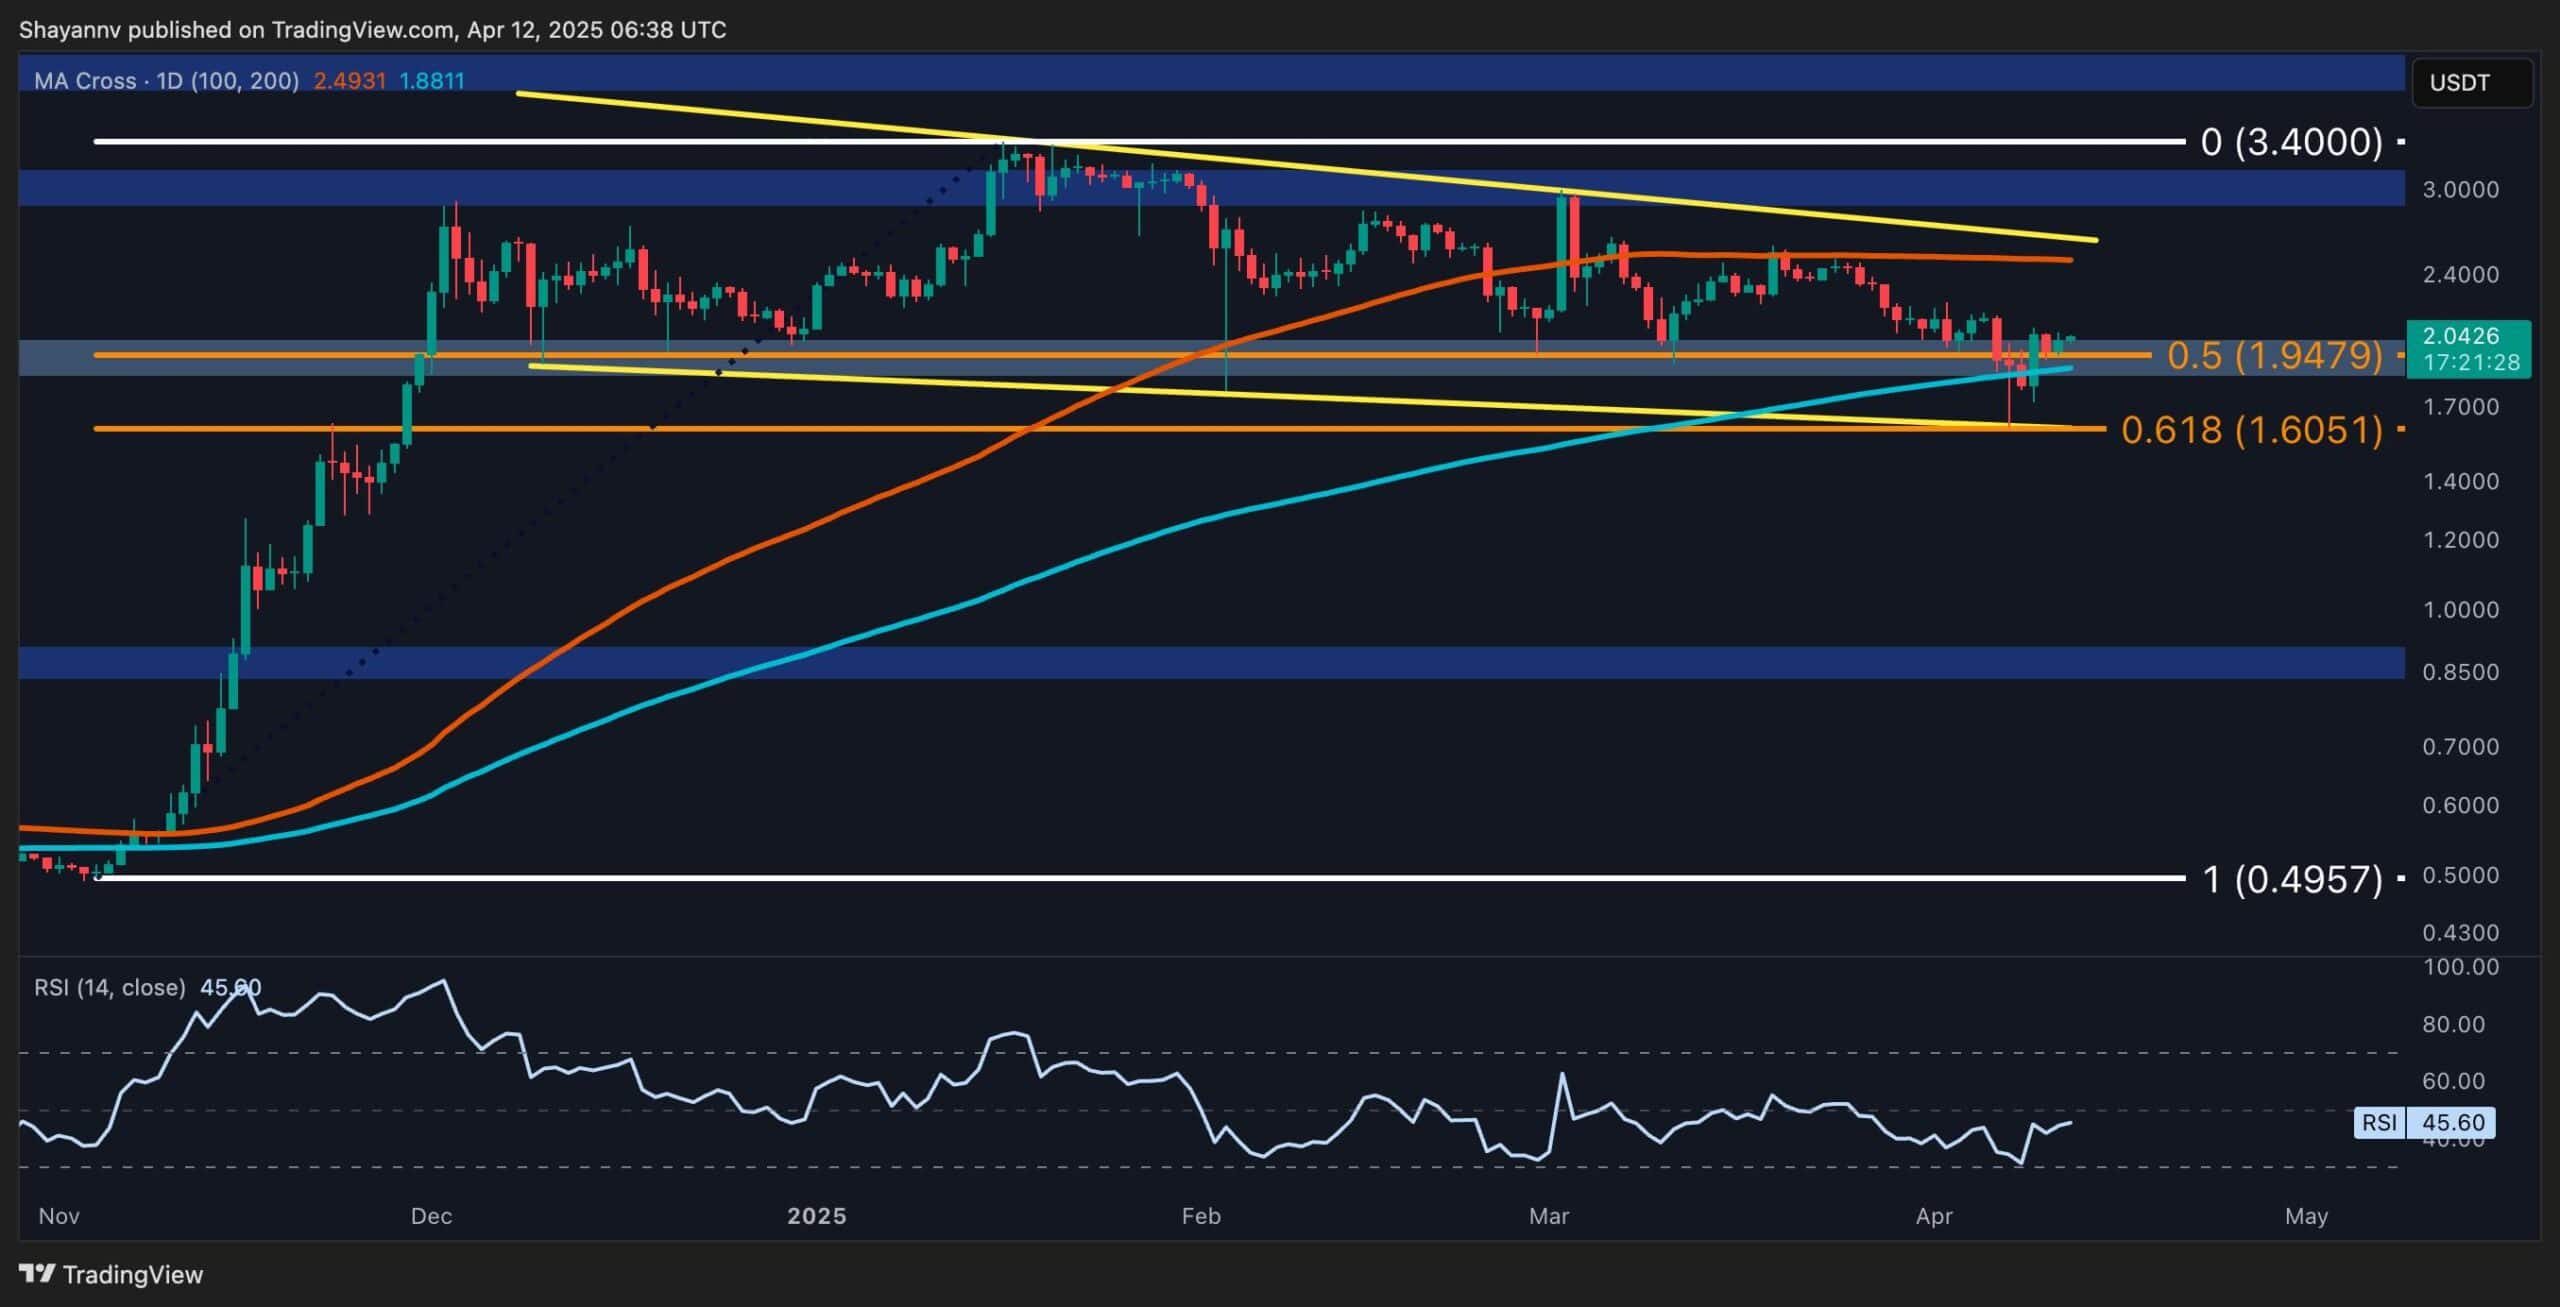
Ripple’s recent impulsive decline has been paused at a significant confluence of support levels, including the 200-day moving average at $1.8, the 0.5–0.618 Fibonacci retracement zone, and the lower boundary of a descending wedge pattern. This zone has acted as a key demand region, temporarily halting the downtrend.
Moreover, the emergence of a bullish divergence between the RSI and price action further supports the possibility of a short-term rebound, potentially targeting the wedge’s upper boundary near the 100-day MA at $2.5.
However, the broader market environment remains characterised by low activity and weak momentum, suggesting that XRP is likely to continue oscillating within the wedge pattern until a decisive breakout occurs.
A valid breakout, either above or below the wedge, could result in significant volatility and liquidation cascades, driving an impulsive move in the breakout’s direction.

The 4-Hour Chart
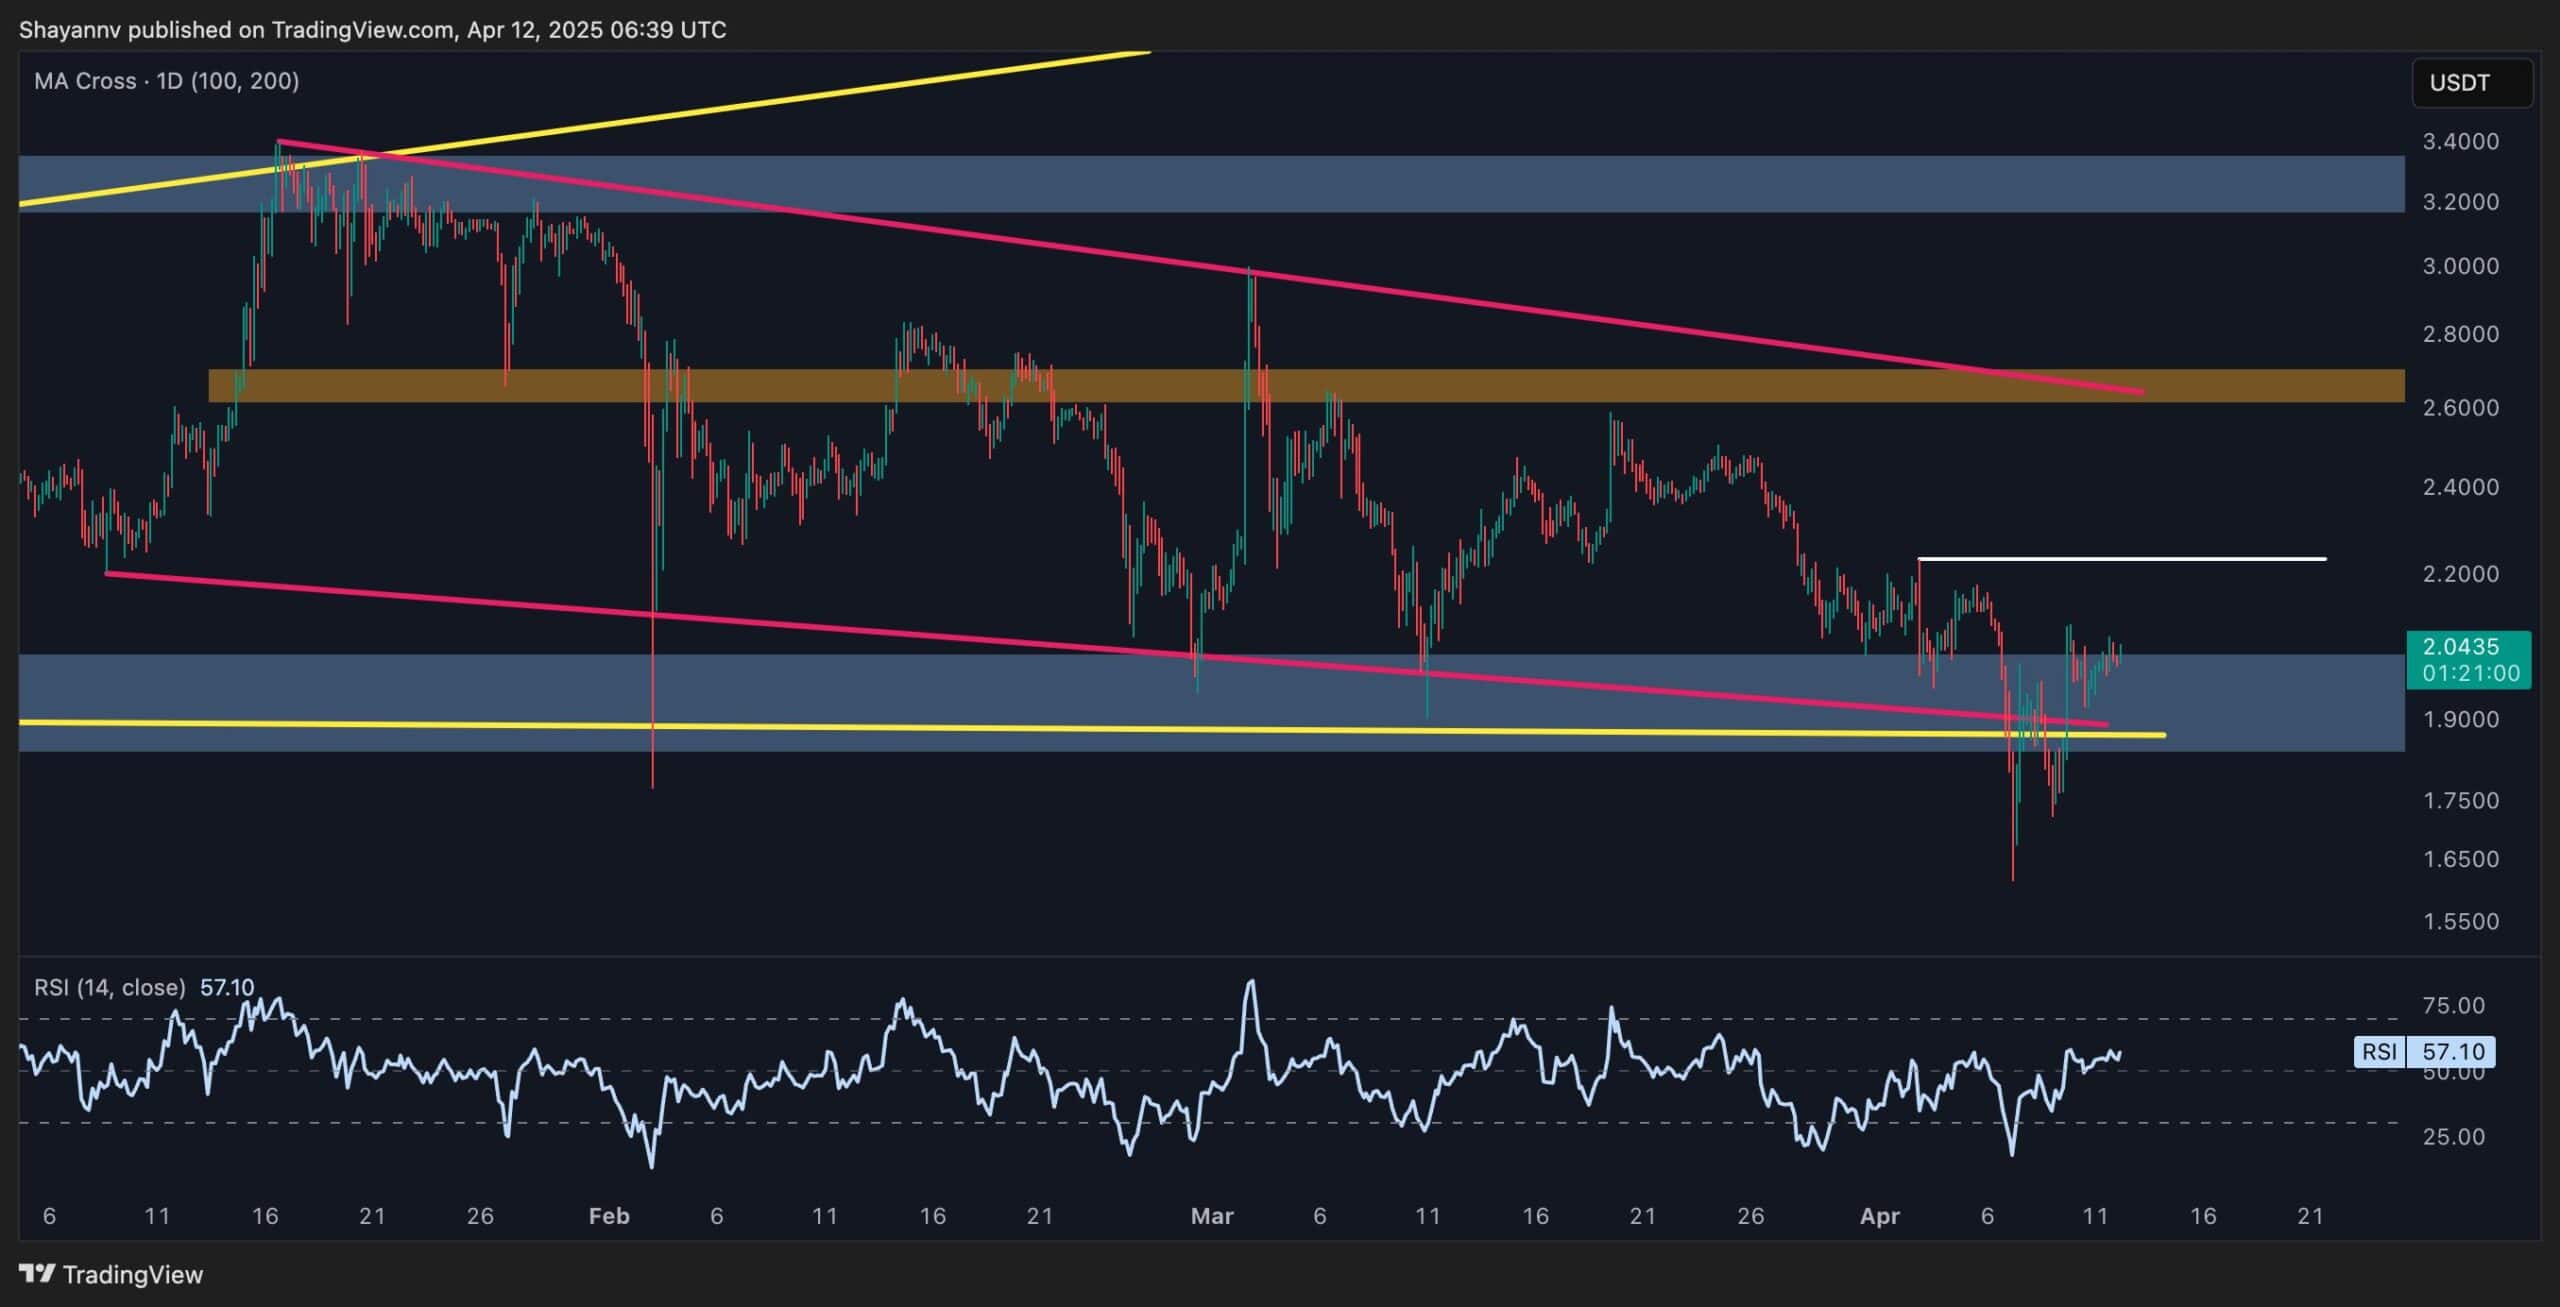
On the lower timeframe, XRP initially broke below both the descending wedge and expanding wedge patterns, triggering a wave of fear and suggesting a bearish continuation. However, this breakdown quickly turned into a false breakout, forming a bear trap as the price bounced back above the broken support levels.
Since then, XRP has been gradually retracing toward its prior swing high of $2.2. A successful breach and close above this level would mark a bullish market structure shift, potentially opening the path toward the $2.5 resistance zone.
Conversely, failure to break above $2.2 would reaffirm the existing bearish structure, making further downside in the medium term more probable.

The post Watch These 2 Criticial XRP Levels This Week: Ripple Price Analysis appeared first on CryptoPotato.


