Bitcoin Price Analysis: $87,000 Next as BTC Holders Refuse to Sell
Bitcoin has found support at the key $80K level, prompting a bullish rebound. However, the 200-day moving average now acts as a significant resistance, suggesting a likely consolidation phase within the $80K–$87K range in the short term. Technical Analysis By Shayan The Daily Chart Bitcoin has recently printed a bullish rebound after finding strong support […]
Bitcoin has found support at the key $80K level, prompting a bullish rebound. However, the 200-day moving average now acts as a significant resistance, suggesting a likely consolidation phase within the $80K–$87K range in the short term.
Technical Analysis
By Shayan
The Daily Chart
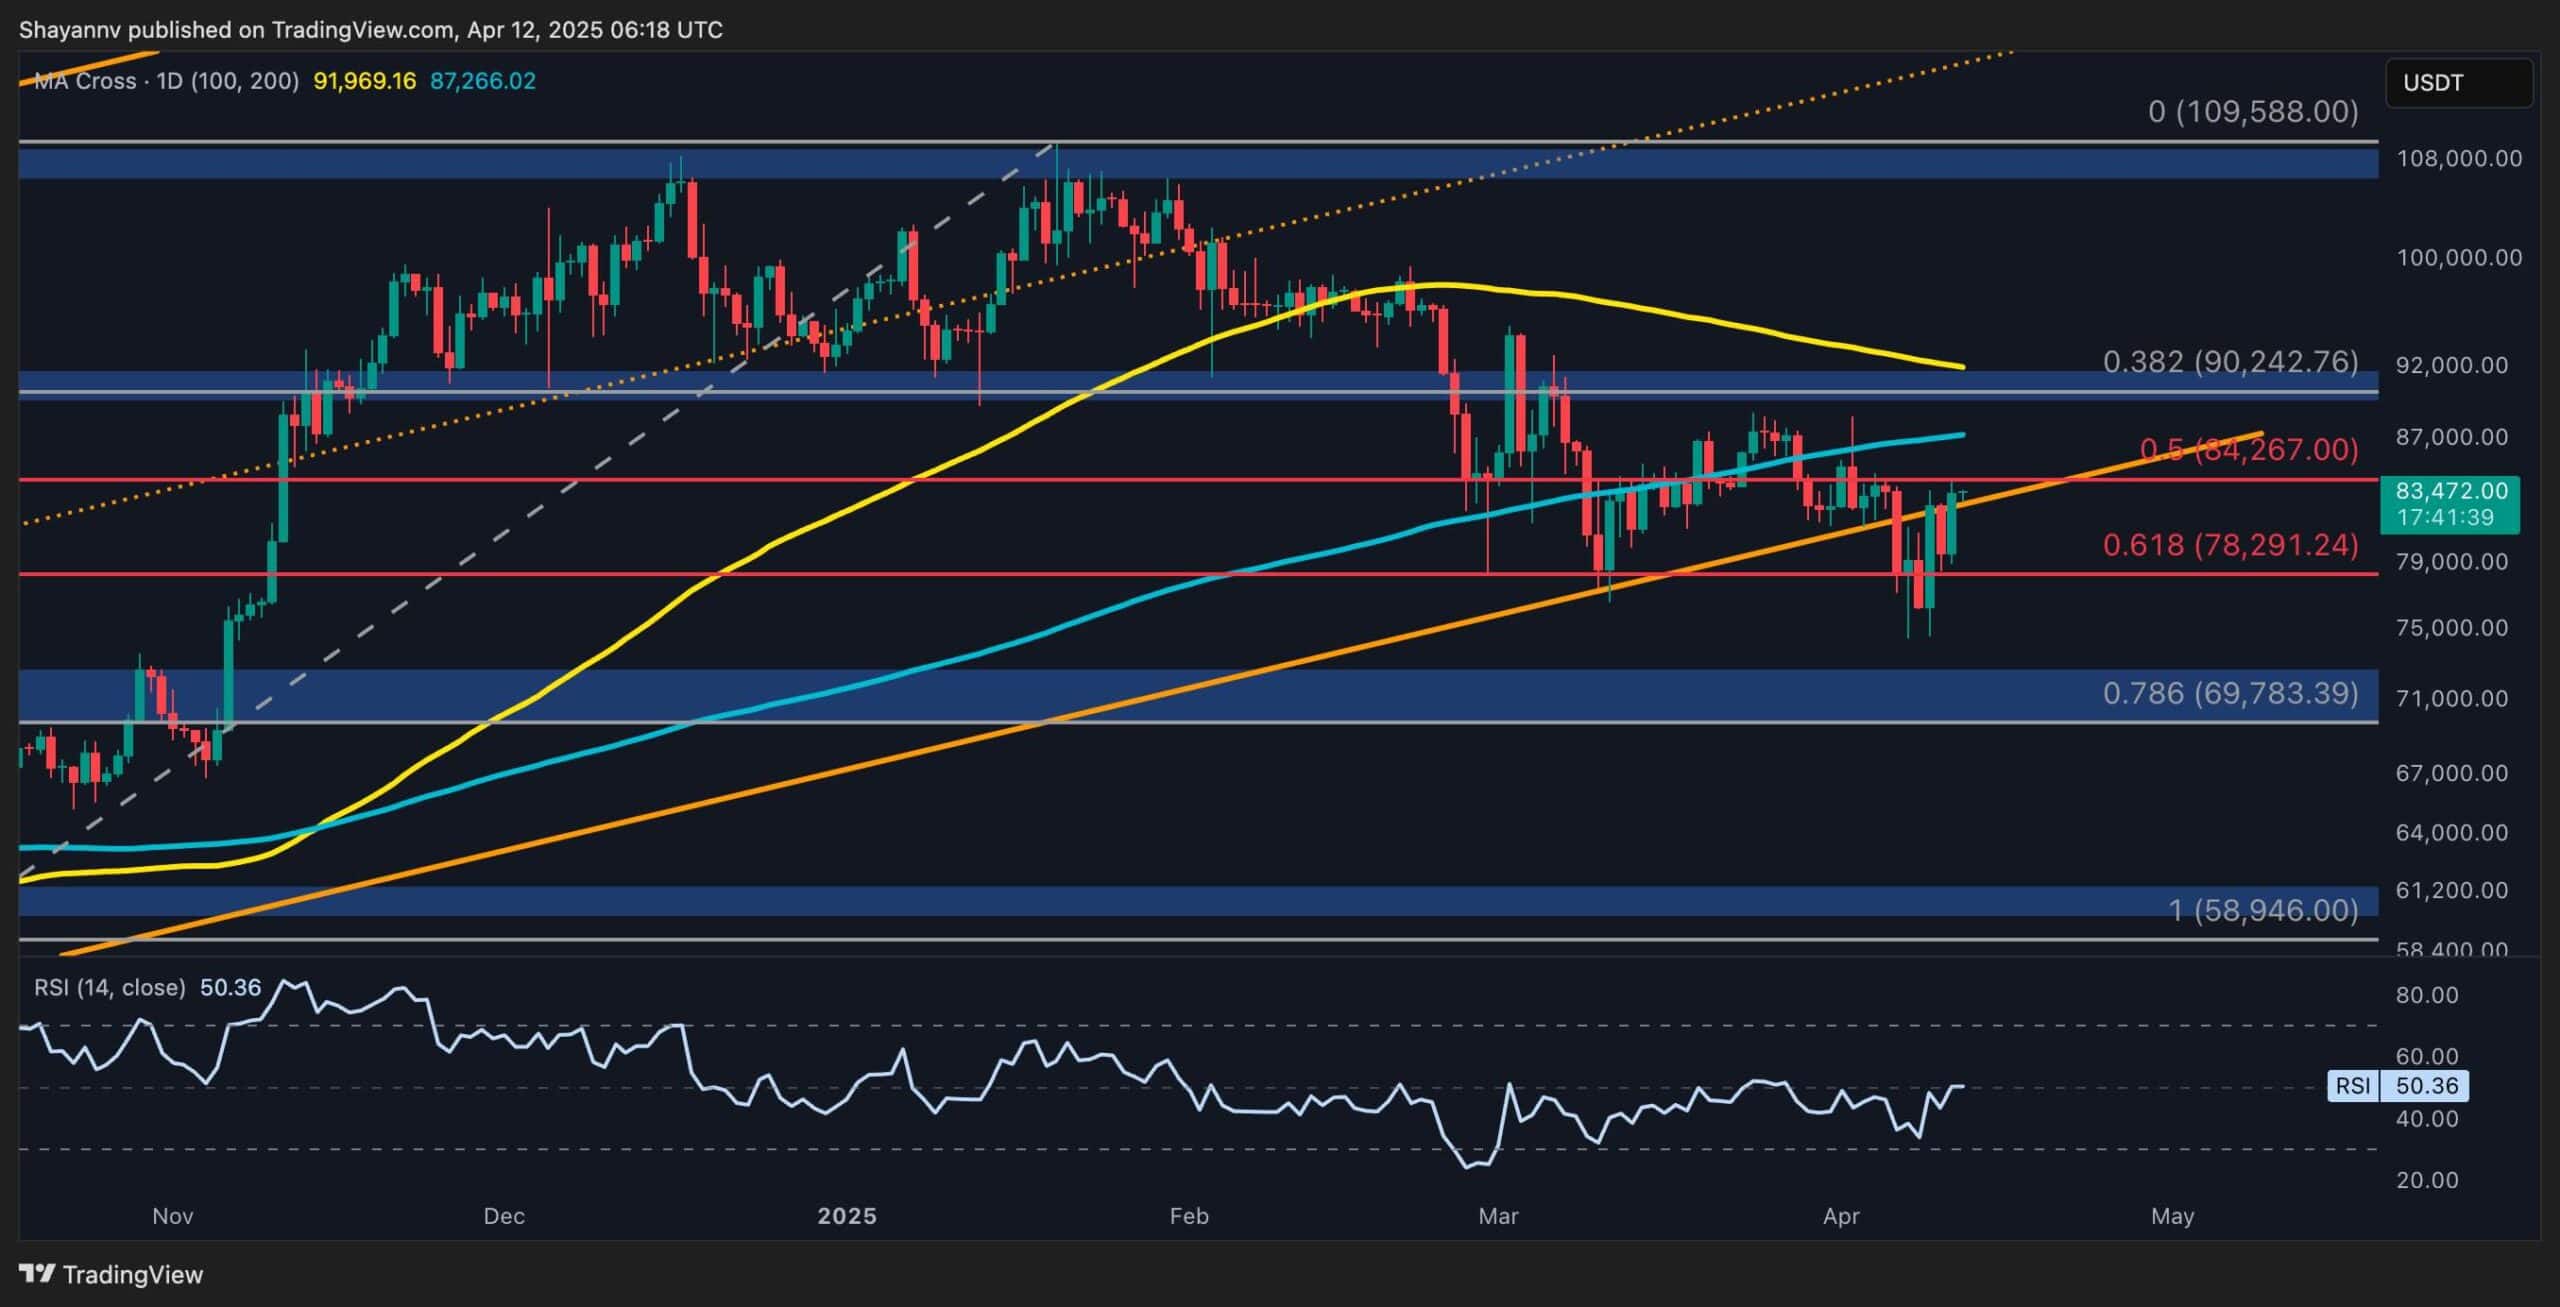
Bitcoin has recently printed a bullish rebound after finding strong support at the key $75K–$80K range. This area has historically acted as a psychological and technical floor, and the bullish divergence between the RSI and price confirmed a slowdown in bearish momentum, signaling renewed buyer interest.
However, the current rally is approaching a critical resistance level, the 200-day moving average at $87K.
This MA serves as a dynamic resistance zone and could cap the price in the short term. As a result, Bitcoin is likely to continue consolidating within the $75K–$87K range until a decisive breakout occurs. If bulls succeed in pushing above the 200-day MA, the next major target lies at the psychological $100K level.

The 4-Hour Chart
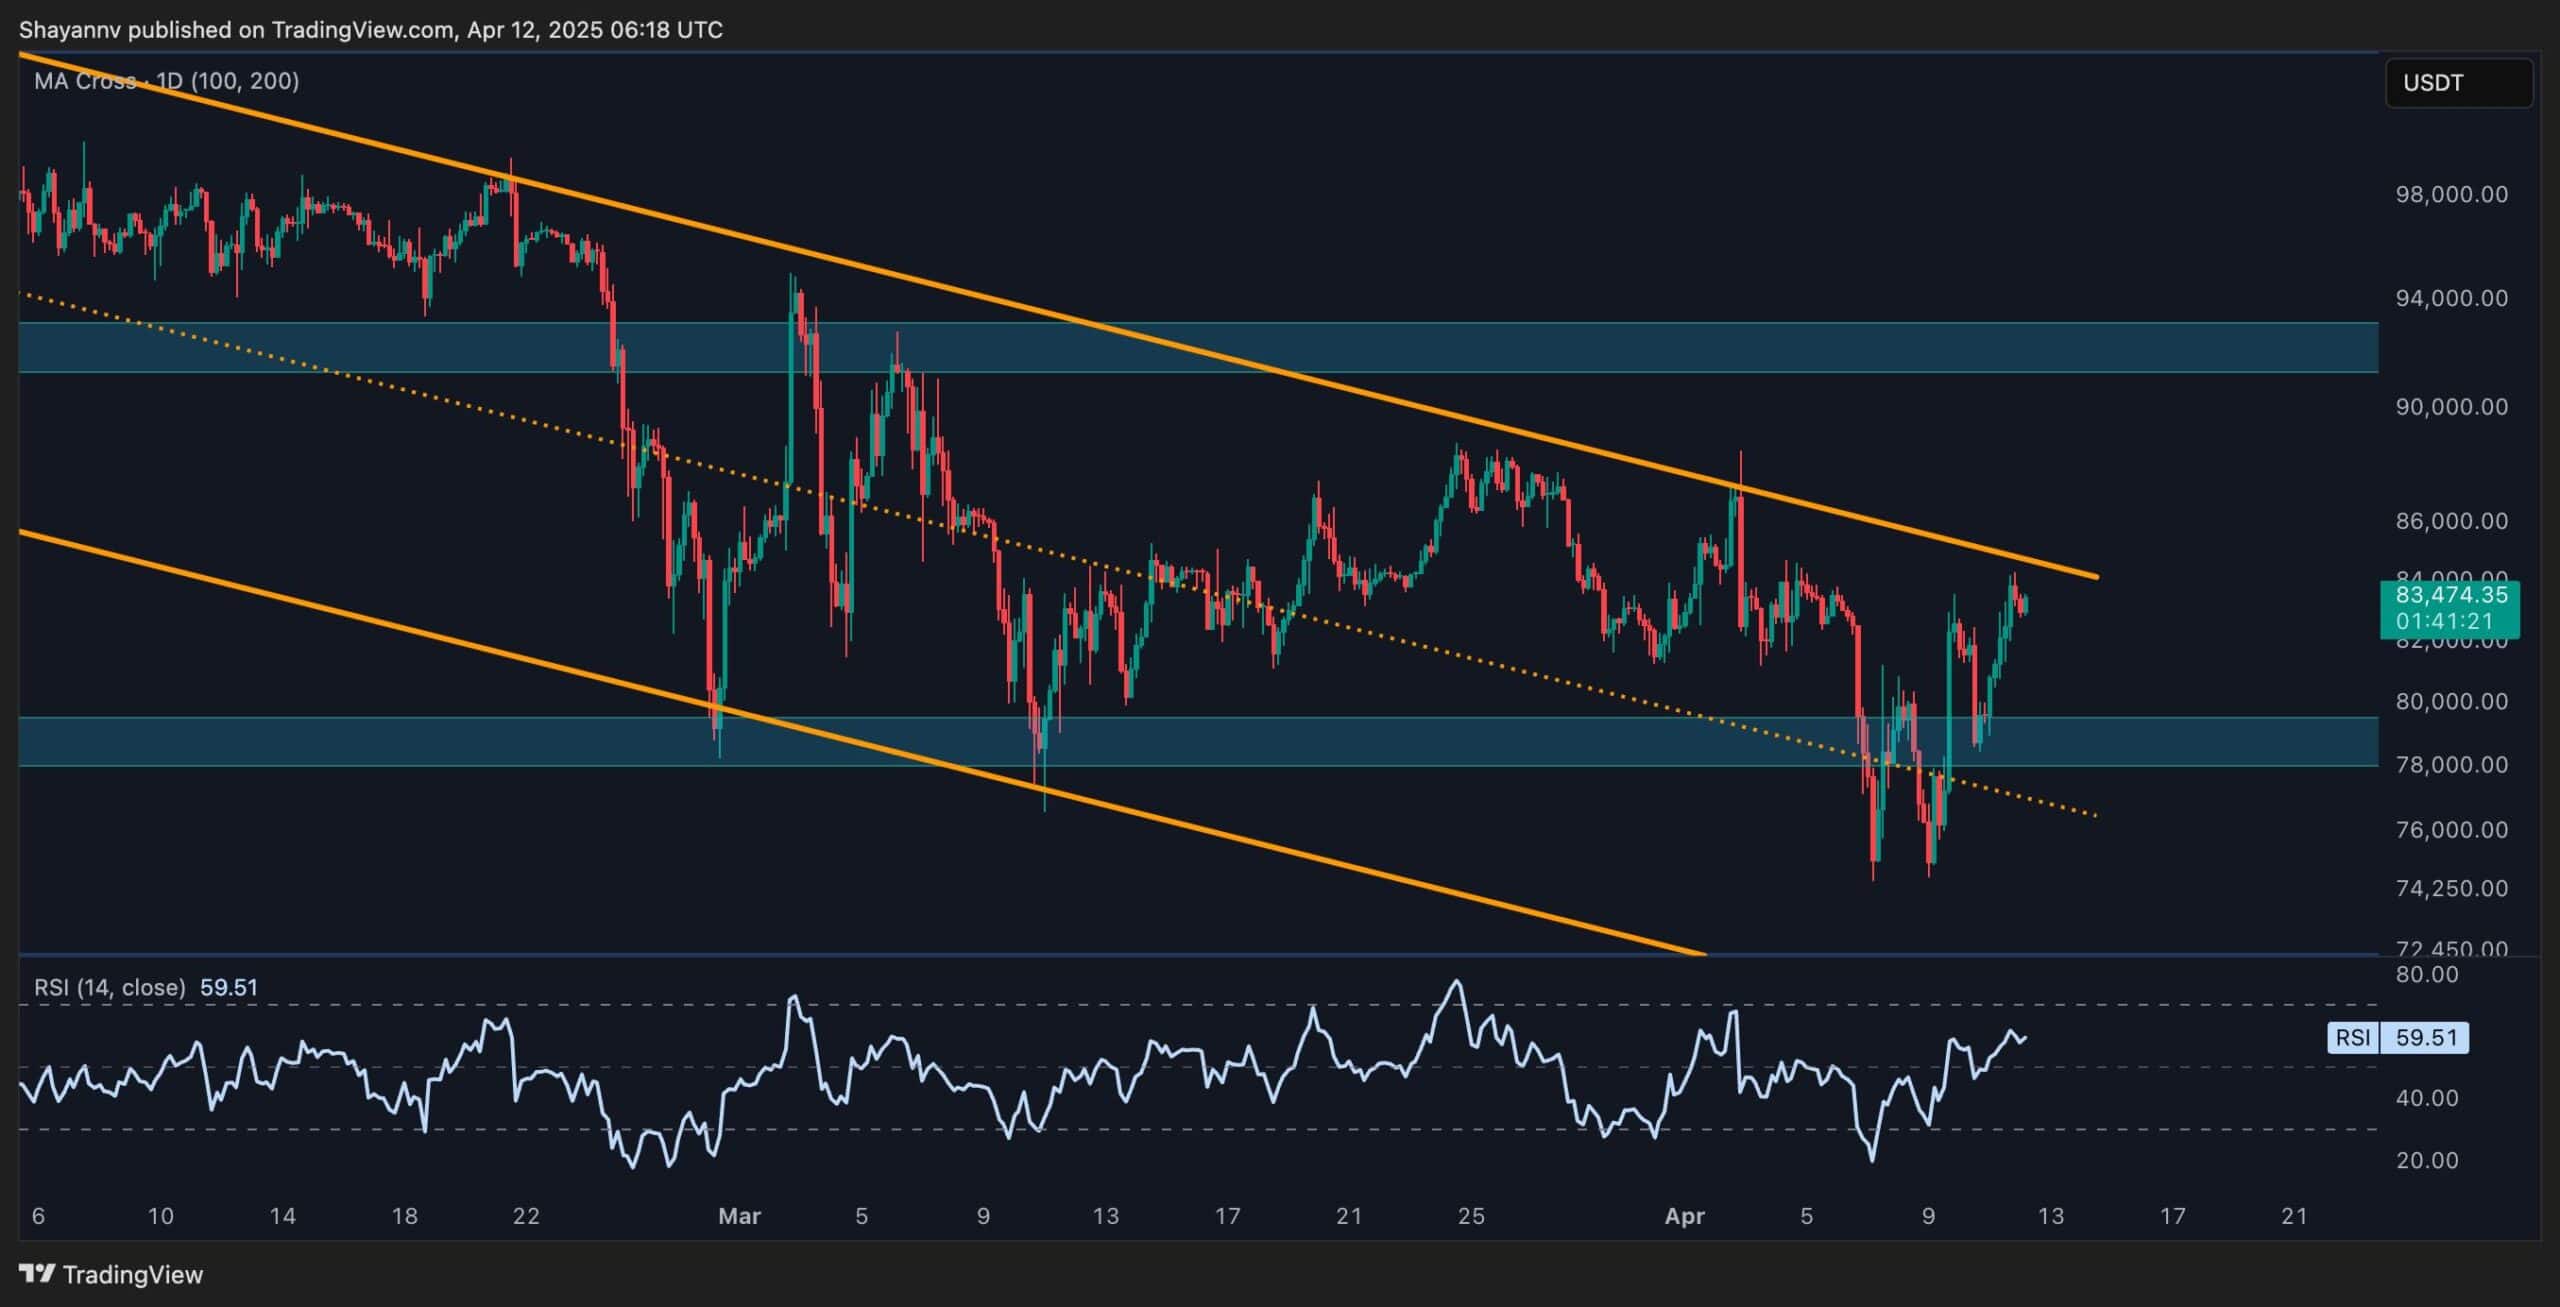
On the lower timeframe, Bitcoin found strong support at the midline of the descending channel, prompting an impulsive surge, a potential signal of accumulation at these levels. The price is now testing the upper boundary of the channel near $84K.
A confirmed breakout above this trendline and the previous swing high would invalidate the bearish structure, opening the path toward the key $90K resistance zone.
Conversely, failure to break above this level would reinforce the current bearish market structure, likely resulting in renewed downward pressure in the mid-term.
On-chain Analysis
By Shayan
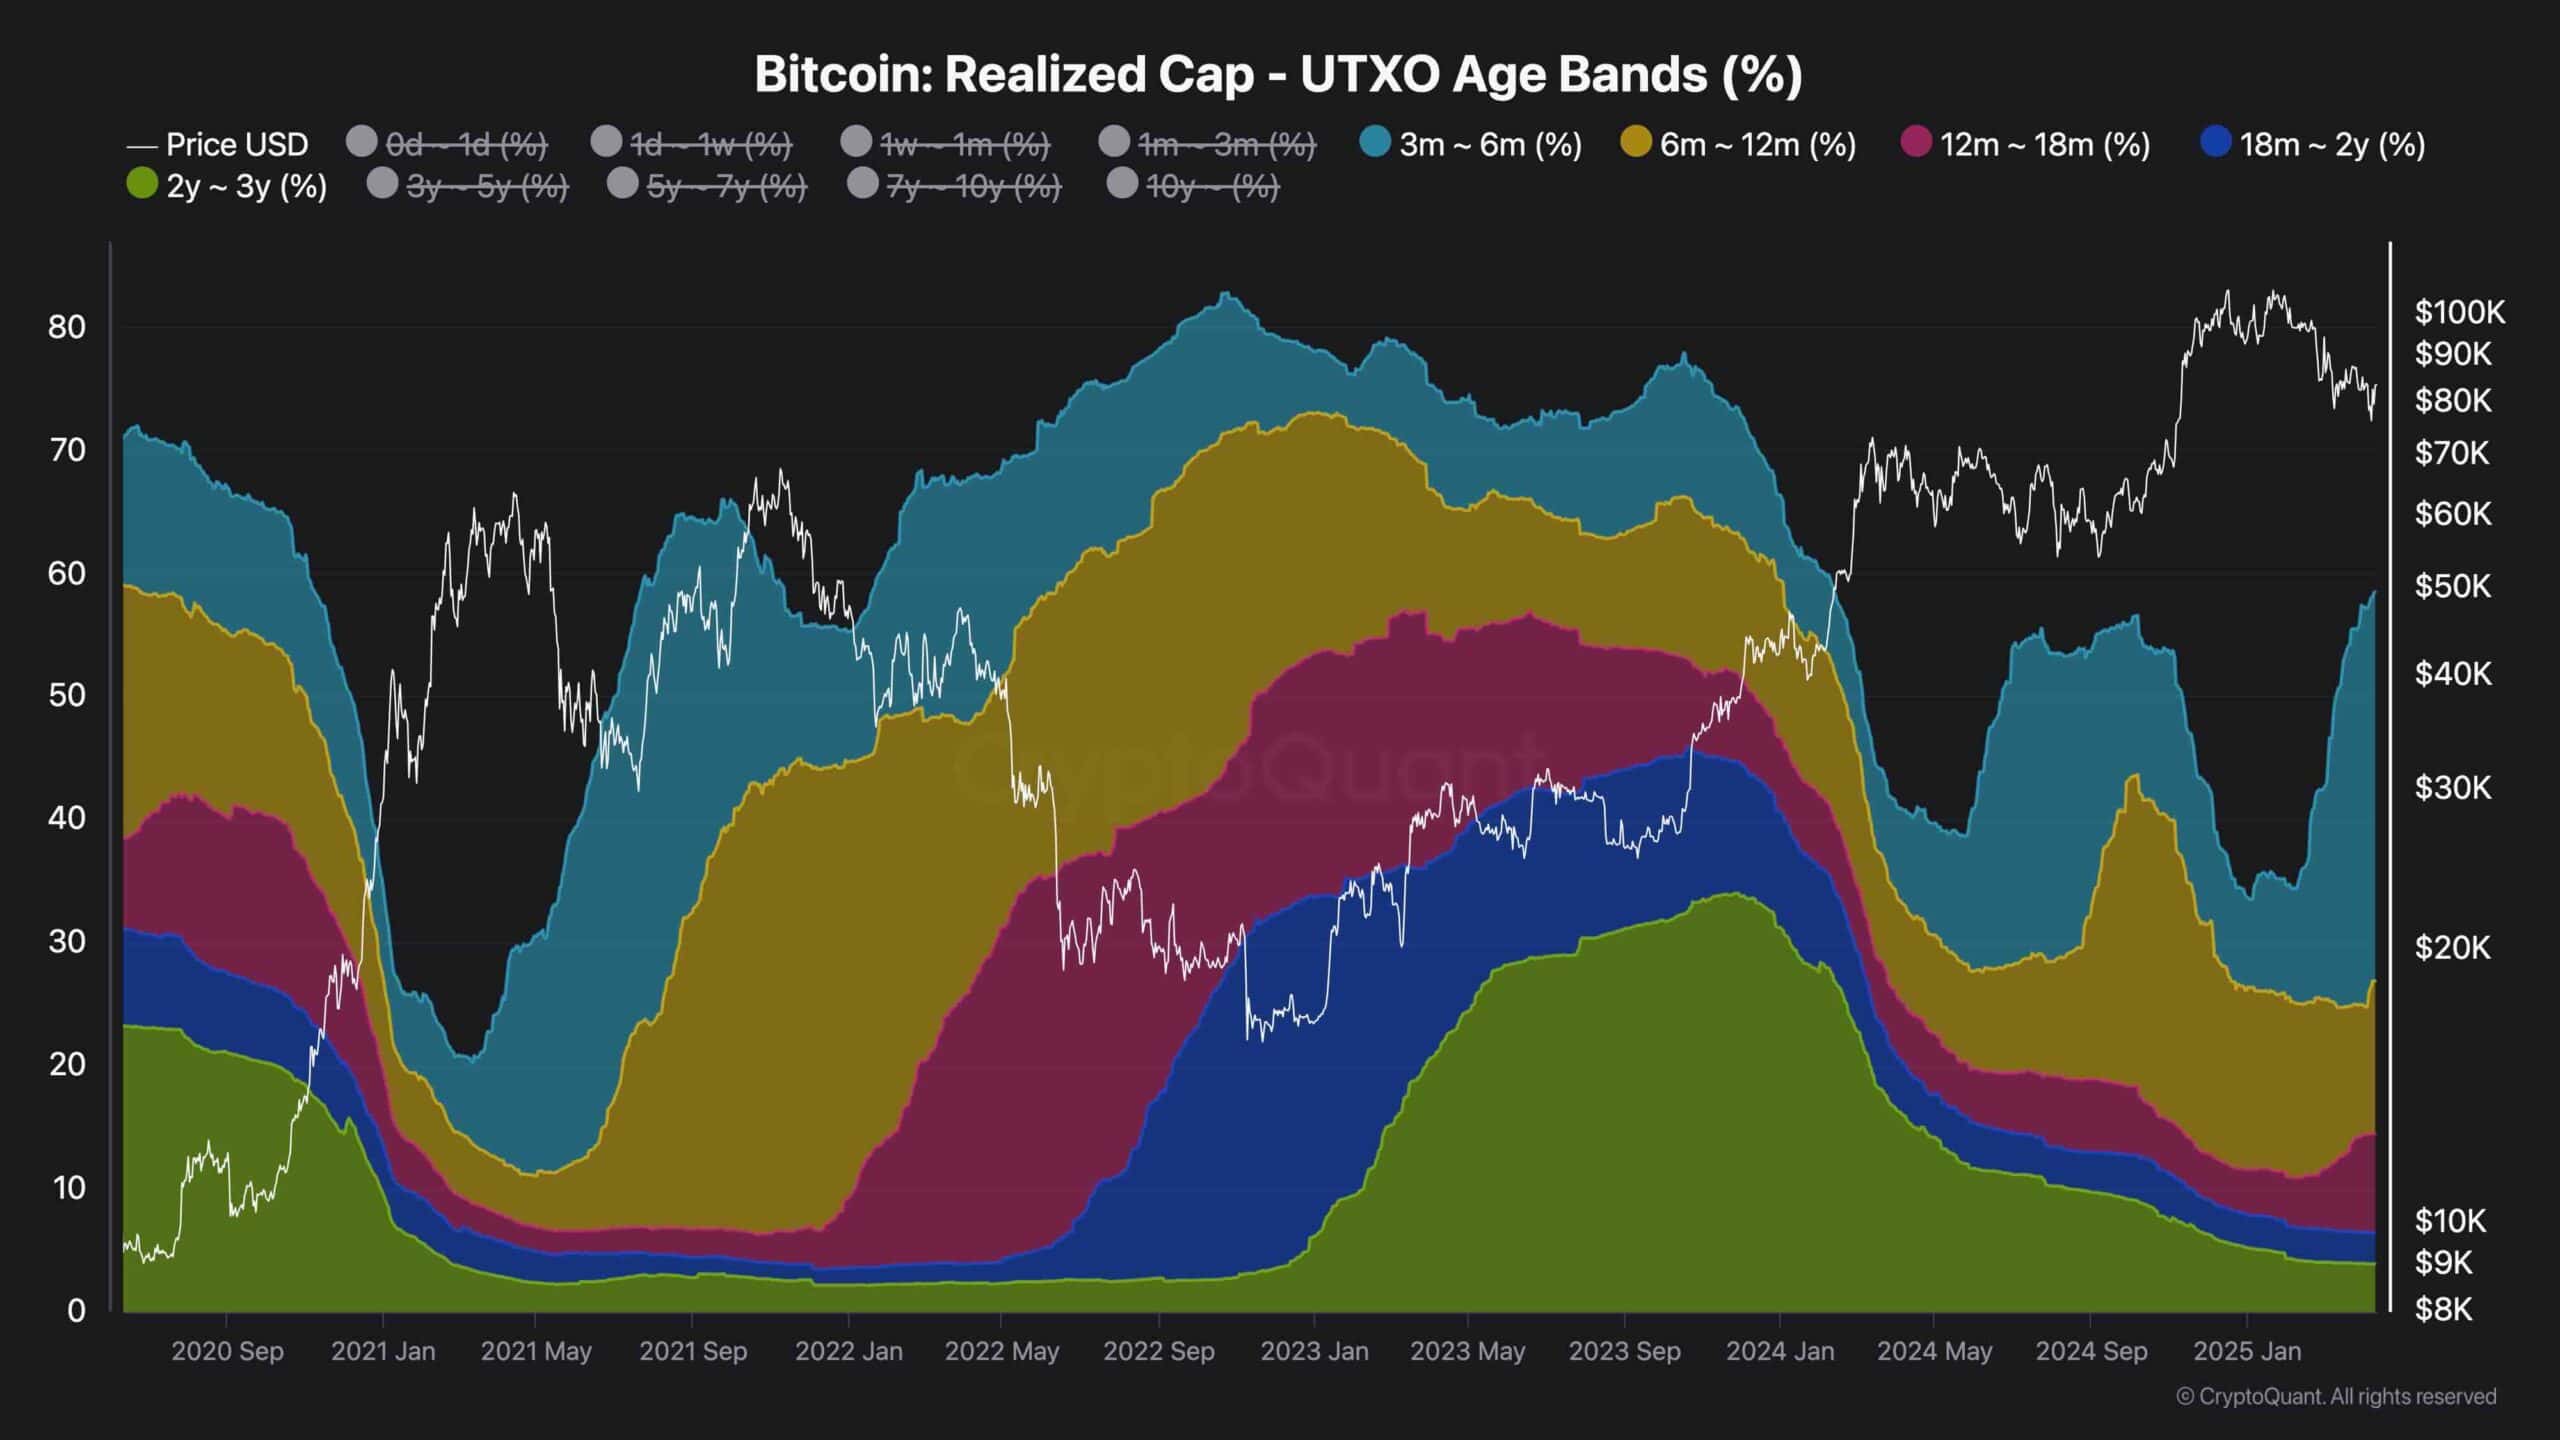
The Realized Cap UTXO Age Bands (%) is a powerful on-chain metric that breaks down Bitcoin’s realized cap by the age of UTXOs (unspent transaction outputs), offering insight into investor behavior based on holding duration.
According to the most recent data, the share of coins held by the 3–6 months and 6–12 months cohorts has been climbing steadily. This rise closely mirrors the accumulation patterns seen during the prolonged correction in the summer of 2024, reflecting growing conviction among holders.
This behavior points to a “hodling” trend, where investors keep their coins despite the ongoing market correction, refraining from selling even in the face of volatility. As more coins move into the hands of long-term holders, the available circulating supply shrinks, increasing Bitcoin’s scarcity.
Historically, such supply constraints, when met with renewed demand, have been catalysts for strong price rallies. These dynamics often set the stage for price discovery and new all-time highs.
Therefore, the current on-chain structure indicates that the ongoing drawdown is less likely to be the beginning of a bear market and more likely a healthy correction within a broader bullish cycle.
The post Bitcoin Price Analysis: $87,000 Next as BTC Holders Refuse to Sell appeared first on CryptoPotato.